

Another June in the Record Books
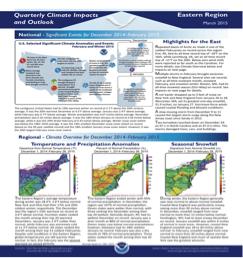
A record-setting heat wave during the second half of June pushed the Northeast to the warm side of normal for the month. In fact, Islip, NY, had its hottest June on record, while another 28 major sites experienced one of their 20 hottest Junes. Summertime convection produced a hodgepodge of precipitation amounts, from 19% in Worcester, MA, (its fifth-driest June) to 177% in Rochester, NY (its 12th-wettest June).
Read more in the NRCC BlogNortheast News
Extreme Weather in June
The Northeast has seen several notable weather events this June including devastating flooding, multiple tornadoes, and record-setting heat. A few examples are listed below. A full writeup of June weather such as temperature and precipitation records, drought conditions, and notable events will be available in early July here.
- Up to 4 inches of rain (based on radar) fell in a short period of time in part of Ohio County, WV, resulting in devastating flash flooding and at least 8 deaths.
- An EF-1 tornado in Oneida County, NY, resulted in three deaths, likely making its New York’s deadliest tornado since July 2014 and third deadliest since records started in 1950.
- A significant heat event brought record-setting temperatures to the Northeast, which you can read more about here.
Website Highlights
Weather Station Data
Weather Station Data includes location-specific information, such as wind data, evapotranspiration, and daily almanacs.
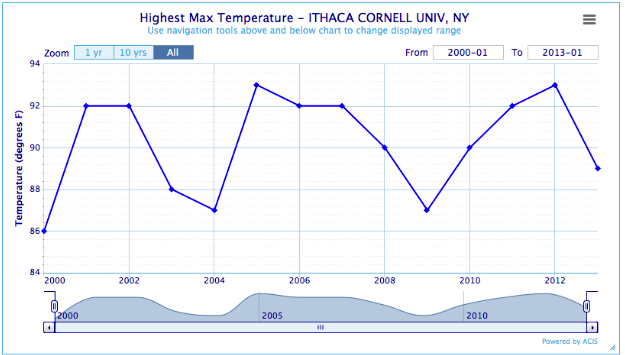
CLIMOD 2 is a user-friendly website to find single-station and multi-station climate products for locations accross the country. For example, the Seasonal Ranking report produces a graph and table of extremes or other summaries for a specified period for each year.
Go to CLIMOD 2State & Regional Analyses
These provide several map types, regional climate summaries, snow survey data, and drought information.
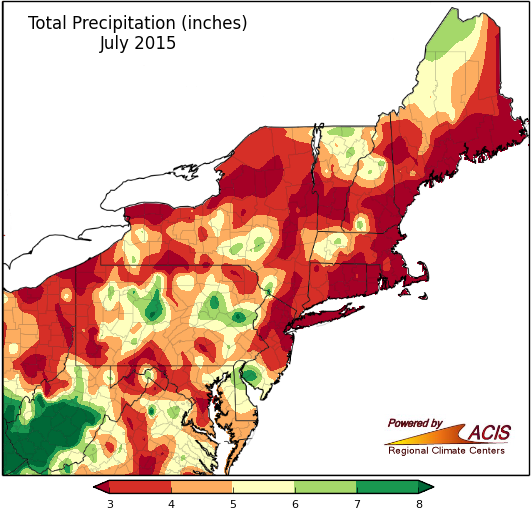
The Monthly Maps offer a variety of monthly precipitation and temperature departure maps for any given month for the Northeast region or a selected state.
Go to Monthly Map pageAnalyses for Industry
Analyses for Industry shows products the NRCC has created through partnerships with various industries.
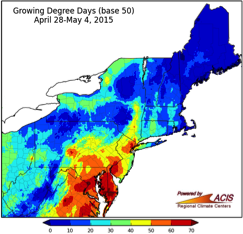
The Turf Grass page offers weather for the turfgrass industry, including disease risk, turf and weed development, irrigation information, and heat stress.
Go to Turfgrass pageWebinars & Workshops
Webinars & Workshops provides recordings and presentations from the monthly webinar series, as well as information on past and upcoming workshops.

The Northeast Regional Climate Center hosts a monthly webinar series with NOAA affiliates to address timely weather topics.
Go to Monthly WebinarsPublications & Services
Publications & Services includes the NRCC blog, quarterly outlooks, as well as other reports and publications.
The Quarterly Outlooks are seasonal climate highlights and outlook for the upcoming season for the Eastern, Region, Great Lakes, and Gulf of Maine. Published in March, June, September and December.
Go to Quarterly Reports